14 June 2022
Market Making JPEGs




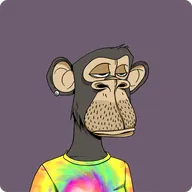






















































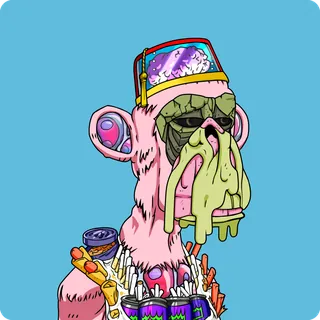






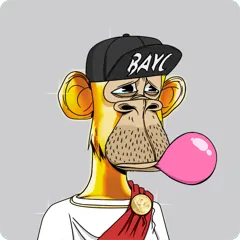






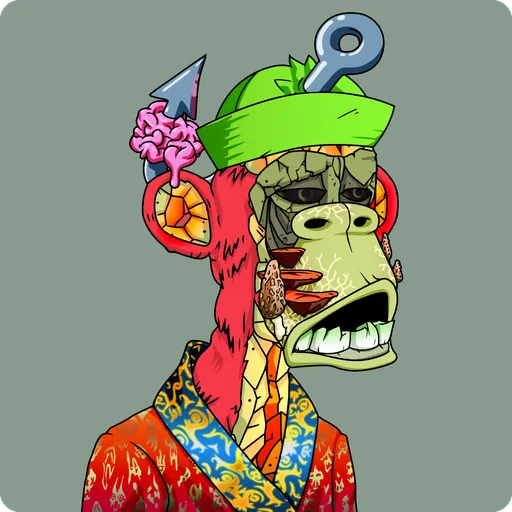





- 720
- NFTs flipped
- 84%
- Win rate
- +22%
- Median return
- 8.0
- Sharpe ratio
01 — Summary
The Strangest Market in the World
In late 2021, monkey pictures traded like penny stocks. New NFT collections launched every day, prices could swing 50% in an afternoon, and a cartoon ape with laser eyes might sell for more than an apartment. To most people, it looked like a casino.
I had just started at a crypto HFT firm, and looking at that chaos, I kept coming back to one question: What is this actually worth? If you can answer that question, even roughly, you may have an edge in a market where most people are pricing on vibes.
We built the boring half of the casino: a pricing engine that tried to estimate the value of every NFT in a collection, and a trading system that automatically bought anything listed far enough below that estimate, within seconds, around the clock. This is the story of how it worked, told through the only part that really mattered:
How do you price a JPEG?
02 — Background
What's an NFT?
An NFT is, in essence, not very different from other crypto tokens. The main distinction is that NFTs are issued under a standard such as ERC-721, which makes each token a unique, non-fungible, one-of-a-kind item. These tokens connect to different images because each token points to a small metadata file, and that file contains information such as the NFT's traits, attributes, and associated image.
An NFT collection is simply a group of these tokens. Many collections contain around 10,000 items, though the number varies. Within a collection, traits are often what matter most to buyers. Each trait appears at a different frequency, so some are common while others are relatively rare.
Here we take an example from the Bored Ape Yacht Club, token id 3749
This is the data linked to the token stored on Ethereum.
{
  "image": "ipfs://QmQpxqZ6hPnx8ofapPVgbg9JAh7S9oh3fNYvWwU7okdCU8",
  "attributes": [
    {
      "trait_type": "Mouth",
      "value": "Small Grin"
    },
    {
      "trait_type": "Hat",
      "value": "Sea Captain's Hat"
    },
    {
      "trait_type": "Eyes",
      "value": "Laser Eyes"
    },
    {
      "trait_type": "Clothes",
      "value": "Black T"
    },
    {
      "trait_type": "Background",
      "value": "Yellow"
    },
    {
      "trait_type": "Fur",
      "value": "Solid Gold"
    }
  ]
}Lifecycle of an NFT collection
- 1CreateThe project generates the art and metadata for every piece and uploads them to the blockchain.
- 2MintThe collection opens to the public; buyers pay a fee to mint a random token, and the art is revealed once minting closes.
- 3MarketplaceOwners list their tokens for sale on the chain's major marketplaces.
- 4Price discoveryAs trading picks up, the market decides which traits deserve a premium, and prices begin to diverge.
Most of the blue-chip NFTs lived on Ethereum, and that's where the whole thing began. Back in June 2017, two developers at Larva Labs released CryptoPunks: 10,000 pixel-art portraits, built almost as an experiment and claimable for free. It predated ERC-721, the standard that would later give every NFT on Ethereum a common format, and effectively created the template every project after it would copy. Four years on, the Bored Ape Yacht Club turned that template into a cultural phenomenon. A wave of projects followed, and a handful of names came to define the era:

CryptoPunks
- Chain
- Ethereum
- Launched
- Jun 2017
- Supply
- 10,000
One of the first Ethereum NFT projects and an inspiration for the ERC-721 token standard. 10,000 algorithmically generated pixel characters, originally claimed for free in 2017, that became the template for profile-picture collecting and the ultimate blue-chip status symbol.
Where NFTs live
NFTs were never only an Ethereum story. They also became a kind of onchain identity, as communities formed around specific ecosystems and each blockchain developed collections that felt native to its own culture. Faster and cheaper chains became more attractive because they reduced the cost and friction of minting and trading, helping drive the rise of Solana's NFT scene. At the same time, flagship applications made these ecosystems more vibrant, most notably NBA Top Shot on Flow and Axie Infinity on Ronin, the Ethereum-linked sidechain created for that game. Roughly how the major venues compared:
| Chain | Marketplaces | Chain characteristics |
|---|---|---|
| Ethereum | OpenSea, LooksRare, Blur | ~12s blocks · ~$10–30 gas per NFT trade in 2021, over $100 at peak |
| Solana | Magic Eden, Solanart | Sub-second blocks · gas under a cent |
| Flow | NBA Top Shot | Purpose-built consumer chain for NBA Top Shot · no crypto wallet needed |
| Ronin | Axie Marketplace | Purpose-built sidechain for Axie Infinity · near-zero gas |
At the centre of the crypto hype in 2021, the surge in NFT demand kept Ethereum heavily congested. Congestion was costly: every purchase and sale competed in Ethereum's gas market, with fees during peak periods often climbing into the hundreds of dollars.
From a trading perspective, participating in this market would have meant sending many transactions just to win a single underpriced listing. On Ethereum, paying $50 to $200 in gas for every attempt would have made even testing the strategy prohibitively expensive, and in many cases could have wiped out any profit before it was realized. Solana offered a far better starting point: near-zero fees, sub-second block times, and a constant stream of new collections launching every day. That's how we started on Solana.
03 — The Pricing Engine
How to Price an NFT?
From CryptoPunks and Bored Apes to DeGods and Mad Lads, every NFT collection shares the same basic structure: each piece is assembled from a set of traits, some common, some rare, and that mix is what makes one token worth more than another. So when you value an NFT, one number matters more than any other: Rarity. That is where the pricing engine starts. It reads each token's trait metadata and turns it into a rarity score, which lets us rank the whole collection from most to least rare. We then price that ranking against real market data, the current listings and recent sales, to get a sense of what each rank should trade for. Some traits are more appealing and worth more than others, so we nudge the result to match the market. Finally we compute our trigger price after fees and required edge. What comes out the other side is a roughly right number: a sensible price for every token in the collection.
Let's walk through an example with the Bored Ape Yacht Club. We grab the data from the real 10,000-ape collection and see how the engine turns a single ape into a fair value.
- 01RankScore every token by rarity
- 02PriceMap the score onto market data
- 03NudgeMove prices to match the market
- 04TriggerApply fees, and ask for more edge
The pipeline of our pricing engine.
1 · Rank — rarity is a choice, not a fact
Coming up with a rarity score is not the hard part. The catch is that there is no single standard: the public uses several, and they can disagree by a lot. The three most common are the trait-sum score, statistical rarity, and the rarity.tools score.
Trait-sum score
score = Σ (collection size ÷ trait count)
Add up how rare each trait is. This score emphasizes specific rare traits: one very rare trait can lift a token to the top.
Statistical rarity
score = log [ 1 ÷ Π (trait probability) ]
Multiply the odds of every trait, the way you'd price a poker hand. This score emphasizes all-around rarity: a token that is rare across many traits at once rises to the top.
rarity.tools score
score = Σ [ (collection size ÷ trait count) ÷ category values ]
The same additive idea as trait-sum, but each trait category is scaled so no single category can dominate the total. This is the score used by rarity.tools, a popular NFT rarity ranking site, standard to use if the collection is listed here.
Custom ranking
score = the project's official list
Some teams publish their own ranking, usually only on their website. When they do, the market trades on it.
Different formulas can produce very different results, because each one weighs traits in its own way. The trait-sum score leans on a single standout trait, while statistical rarity rewards being rare across many traits at once. The example below runs all three on the Bored Ape Yacht Club: watch how the same ape can land at a wildly different rank just because the formula changed.
Top 20 leaderboard
Score = Σ (10,000 ÷ trait count)
Rarity score

BAYC #8135
- Background Army Green1243/10k
- Clothes Hip Hop128/10k
- Earring Silver Stud823/10k
- Eyes Hypnotized220/10k
- Fur Black1229/10k
- Hat Trippy Captain's Hat65/10k
- Mouth Bored Unshaven Dagger28/10k
- Trait count 7 of 71883/10k
Highlights NFTs with one specific, very rare trait.
score 668
score 11.92
score 317
Same ape, a 6-place spread across formulas.
So which formula should we use? It depends. In a market priced by belief, the right formula is whichever one the crowd ends up using. We apply the score most retail traders are likely to reach for, weighing:
- which rarity sites are popular for the collection, since different sites and different chains may use different formulas;
- which formula best fits where the collection's recent trades have landed;
- whatever the project itself has endorsed, if it has published an official ranking.
Trading on the wrong ranking can get expensive, and we learned that the hard way. The lesson: your model isn't the truth, it's only a forecast of what the market will believe.
2 · Price — let past trades price each rank
A ranking only tells you that one ape is rarer than another. It doesn't tell you what either is worth. Another useful input for pricing is market data: the current listings, the floor price, and above all the recent trades.
Let's plot our rarity score against each and see what they tell us.
Live listings vs rarity
The live listings really scatter everywhere. That's understandable: a seller can ask whatever they like, so there is no clean shape here. Look closely at the denser dots near the bottom, though, and you can make out a faint upward drift.
Now let's see how the rarity score lines up against past trades instead.
Last trades vs rarity
It shows a pattern: prices sit near the floor through most of the collection, then turn sharply upward in the rare tail. That is the insight we are interested in.
We turn each token's score into a percentile, group the collection into a handful of rarity buckets, and read off the recent trades to answer one question per bucket:
How much premium over the floor does this band deserve?
| Percentile | Band | Where recent trades land | Premium |
|---|---|---|---|
| 30th | 0–30th | Right at the floor, ~10 ETH | +0 |
| 50th | 30–50th | No real change, ~10 ETH | +0 |
| 70th | 50–70th | Still hugging the floor, ~10 ETH | +0 |
| 85th | 70–85th | The trend starts to lift, 10–15 ETH | +2.5 |
| 95th | 85–95th | Clearly above the floor now, 15–25 ETH | +5 |
| 99th | 95–99th | A steep premium, 25–35 ETH | +10 |
| 100th | 99th+ | The trophy tokens, 40+ ETH | +30 |
We pin those steps to the buckets and draw straight lines between them. That is the first draft of our theoretical price (theo).
Now let's lay that theo back over the data and see if it is legitimate.
Pricing curve vs the market
As you can see, the theo is not trying to price every token exactly. Instead it works out the right floor for each token given its rarity percentile. The premiums are deliberately not a tight fit to the market either: we keep them wider on purpose, which asks for a bigger margin of safety and more edge on every buy. We may trade less volume that way, but our risk is lower too.
With this pricing curve in hand, we can now spot the mispriced opportunities in the market.
Spotting mispriced listings
3 · Nudge — the rarest token isn't always the most wanted
Our theo gives us a solid baseline, but the whole thing rests on one assumption: that rarer means more valuable. Most of the time it holds. Sometimes it breaks, because some traits are simply more appealing to buyers. Bored Apes is the canonical example. The two rarest traits in the collection, Bored Unshaven Pizza (26 out of 10,000) and Bored Unshaven Dagger (28 out of 10,000), are never among the most expensive sales. Instead, the top of the market belongs to Solid Gold fur (46 out of 10,000) and Blue Beams (49 out of 10,000). They are simply better looking and more appealing to the general public.
Thus we need to price this into our system. Look at the order book and it is easy to see: Solid Gold has a much higher listing floor and sells far above its rarity-band peers. In this case, we bump every gold-fur token up to meet it.
The Gold Fur Premium
4 · Trigger — our final price to the market
Before we start shopping the market, two things to keep in mind: fees and edge. Start with the fees.
Fees
Every NFT trade carries three kinds of cost. The marketplace fee is the venue's cut of the sale. The royalty is a percentage paid to the collection's creator on every resale, set by the project, not the venue. And gas is the network fee to settle the trade on-chain.
Marketplace fee
| Marketplace | Chain | Fee |
|---|---|---|
| OpenSea | Ethereum | 2.5% |
| LooksRare | Ethereum | 2.0% |
| Magic Eden | Solana | 2.0% |
| Solanart | Solana | 3.0% |
Royalties
| Collection | Chain | Royalties |
|---|---|---|
| CryptoPunks | Ethereum | 0% |
| Bored Ape Yacht Club | Ethereum | 2.5% |
| Pudgy Penguins | Ethereum | 5% |
| Doodles | Ethereum | 5% |
| Degen Ape Academy | Solana | 10% |
| DeGods | Solana | 9.99% |
| Okay Bears | Solana | 7.5% |
| Monkey Kingdom | Solana | 10% |
Gas Fee
| Chain | Fee |
|---|---|
| Ethereum | $50 to $100 |
| Gas on Ethereum is an auction, a mispriced NFT can set off a gas-fee bidding war. I once watched a single buy pay 15 ETH in gas. That auction dynamic is the tricky part of trading on Ethereum. | |
| Solana | Under $0.001 |
| A fixed fraction of a cent, first come first served. | |
Adding up all these fees, the cost of trading can easily run over 10%, and gas can eat in even further. A snipe needs a big enough discount to clear all of it before we are confident enough to trigger.
Edge
After learning all the costs, the edge is how much we ask for to make a trade worth it. It answers one question: how far below fair value, after costs, would we buy? In other words, our expected profit.
If it were set to zero, every fill would be a coin flip. We could be left holding the token (opportunity cost), and the floor might fall before we resold it (price risk), turning a flat trade into a loss. So we always demand positive edge, and more of it as rarity climbs: a rarer piece ties up more capital, takes longer to resell, and its theo is more opinion than fact, so each trade needs more conviction:
| Rarity bucket | Edge required |
|---|---|
| Common · up to 70th pctile | 15% |
| Trading at the floor, the most liquid zone. | |
| 85th percentile | 20% |
| Starting to lift off the floor, fewer comparable sales to anchor the theo. | |
| 95th percentile | 25% |
| Starting to get more expensive, longer exit and less liquidity. | |
| 99th percentile | 30% |
| Ties up a large amount of capital, requires more conviction. | |
| 99.5th and above | 40% |
| Grails. Ties up the most capital, requires the most conviction. | |
Let's put it together on a common Bored Ape sitting on the floor at 10 ETH. How low would a listing have to drop before the system triggers a buy?
trigger price = theo × (1 − fees) / (1 + edge)
- theo
- 10 ETH
- fees
- 5%
- edge
- 15%
50th percentile fair price
2.5% marketplace + 2.5% royalty
common bucket, up to 70th pctile
10 × (1 − 5%) / (1 + 15%)
= 8.3 ETH
04 — The Trading System
From Listing to Buy in Seconds
We now have a good grasp on what an NFT is worth. Knowing the price, though, is only half the job: acting on it by hand does not scale. New listings land every second, across several marketplaces, at every hour of the day, and an underpriced one is usually gone before a person could even open it. We invested in a system to do the watching and the buying for us. It pipes the latest transactions straight off the blockchain, scores every new listing against the pricing engine, and the instant one clears its edge bar, fires a buy transaction back to the chain.
Market Data, Strategy and Execution are the three core components. Every trade, from a fresh listing to a filled buy, flows through them:
- 1
Market Data
- Decodes every new listing and sale from the marketplaces, surfacing each one for opportunity evaluation.
- Keeps the listing data current, an accurate live book and floor price for Strategy to price against.
- 2
Strategy
- The pricing engine described earlier: scores each listing against its theo and fires a buy once it clears the threshold.
- Recomputes the theo for every new movement in the market.
- Risk evaluation, including retreats and position caps.
- 3
Execution
- Builds, signs and sends the order on-chain through the marketplace.
- For opportunity sniping, fires aggressively to maximize the odds of winning the fill.
The system works differently on each chain, because the Solana and Ethereum marketplaces run on very different designs and trading logic, shaped by the chains underneath: gas cost, transaction ordering, block speed, and more.
Solana
On Solana we decode the chain transaction by transaction. A listing here is itself an on-chain transaction: it moves the NFT into the marketplace's escrow with the price baked into the instruction, so it exists on-chain the instant it is made. As long as we listen to the incoming transactions on each marketplace's smart contract, we have a live, complete picture of the market.
Sniping an opportunity is just sending a transaction, and with near-zero gas and no public mempool or gas auction to bid into, there is nothing to outbid. So we brute-force it, firing many transactions in parallel to maximise the chance that one lands.
Pros
- ✓Listings are equal for everyone, anyone with access to the blockchain sees them at the same speed we do.
- ✓Solana is first-come-first-served, execution is simpler.
- ✓Easy to reconcile, every transaction lives on-chain to look back on.
Cons
- ✗The decoding is a slog, no libraries in 2021 and the marketplaces never publicised their smart contracts.
- ✗Brittle to maintain, any change to a transaction type means reworking the decoder.
Ethereum
Ethereum is almost the opposite. OpenSea was the near-monopoly venue, and it ran on API access rather than on-chain transactions, a listing never touches the chain. To list, a seller pre-signs a message ("sell #123 for 10 ETH") that OpenSea keeps in its own database, with no transaction and no gas, a design forced by Ethereum's $50 to $200 gas. A transaction only fires once someone agrees to buy. That makes the API key the golden ticket: it was not publicly available back then, had to request access for one and heavily rate limited. Thus there was a market for OpenSea API keys, one would need 5+ keys to trade OpenSea algorithmically, there's a real demand for that.
Execution is two steps, the API and then a gas auction. We first fetch the seller's signed order from the API, then submit an on-chain transaction to fulfil it. The gas auction is the other competitive layer on Ethereum: bidding the right fee can make a material difference to the edge we end up with. All in, Ethereum execution is more challenging, a speed-and-gas game, where Solana is first-come-first-served.
Pros
- ✓No decoding work, just follow the API docs to get everything we need.
- ✓Privileged at scale, with many API keys and good rate limits we could pull far more than a normal user.
Cons
- ✗Hard to get a key, and access is gated rather than open to anyone on-chain.
- ✗Rate limits are aggressive, so it takes constant workarounds to pull all the data without getting throttled.
- ✗Extra work to optimise the gas auction, otherwise the fee eats your edge easily.
05 — Results
Flipping NFTs
We put the system into production in early 2022, on Solana first, right as the NFT hype was cresting. It worked. Across 707 flips, 84% closed in profit, with the median flip returning 22% on a one-day hold, which annualizes to about 80x.
That track record gave us the confidence to expand to Ethereum. Ethereum was the far bigger market, more volume and more collections, but also harder to trade. It took on more risk in general: gas was an expensive variable next to Solana ($50 vs $0.001), and the average piece cost an order of magnitude more (100 ◎, ~$10k vs 30 Ξ, ~$100k).
Even against that friction, the edge carried over. The Ethereum book was smaller and started later, but it flipped at a similar hit rate and finished ahead in ETH.
Realized P&L
P&L
+603 ◎
≈ $57,121
Win rate
84%
591 winners out of 707 flips
Median return
+22%
per flip
Median hold
0.67d
per flip
Sharpe
8
Sortino 86.9
Volume
5,689 ◎
≈ $553k · 249 collections
Cumulative realized P&L
Rarity and Return
Grouped by rarity, the rarer buckets return more, which matches the edge we price for. But volume falls as rarity climbs. The goal is striking the right balance between volume and edge.
Trade History
| Token | Bought | Sold | P&L | ||||||
|---|---|---|---|---|---|---|---|---|---|
Collection / Token | Rarity | Date | ◎ | Date ↓ | ◎ | Hold | ◎ | $ | ROI |
Yaku Engineering ONI S-00 TombStoned High Society TombStoned HighSociety Baby Ape Social Club Monkey Kingdom Baepe The Xenobots Project Baby Ape Tiger Club Cardboard Citizens Solana HODL Whales Mile High Ape Club Trippin' Ape Tribe Fearless Bull Club 000 Diamond Hand Terrace 000 Tomorrowland Avenue 00 Tomorrowland Avenue 000 Lan Kwai Fong Road 00 Degen All The Way 000 Ding Ding Lane 000 JPEG Boulevard 000 Wen Moon Lane 00 WAGMI Lane 000 Mint Way 00 Ape Lane #00000 | Uncommon · 00rd Rare · 00rd Rare · 00th Rare · 00st Common · 0th Uncommon · 00th Common · 00th Uncommon · 00st Common · 00st Common · 00nd Grail · 000th Grail · 00th Common · 00rd Uncommon · 00nd Common · 0rd Rare · 00nd Unranked Common · 0nd Common · 0st | 00 May 00 00 Apr 00 00 Mar 00 00 Jan 00 00 Feb 00 00 Dec 00 00 Nov 00 0 Jun 00 0 May 00 0 Apr 00 0 Mar 00 0 Feb 00 0 Jan 00 0 Dec 00 | 00.00 0.00 | 00 Jun 00 00 May 00 00 Apr 00 00 Mar 00 00 Feb 00 00 Jan 00 00 Dec 00 00 Nov 00 0 Jun 00 0 May 00 0 Apr 00 0 Mar 00 0 Feb 00 0 Jan 00 0 Dec 00 | 000.00 00.00 0.00 | 00.0d 0.0d | +00.00 +0.00 −0.00 | +$0,000 −$0,000 +$000 −$000 +$00 −$00 +$0 −$0 | 0,000× +00% -00% 0.0× +0% -0% 00× 0% |
 Baby Ape Tiger Club #4770 | Uncommon · 73rd | 9 Jun 22 | 0.42 | 14 Jun 22 | 0.56 | 4.7d | +0.14 | +$0 | +33% |
 Magnum #1272 | Rare · 93rd | 7 Jun 22 | 1.44 | 13 Jun 22 | 1.68 | 6.5d | +0.24 | −$9 | +17% |
 LabMonke #2549 | Rare · 94th | 6 Jun 22 | 0.28 | 11 Jun 22 | 0.33 | 4.6d | +0.05 | −$1 | +16% |
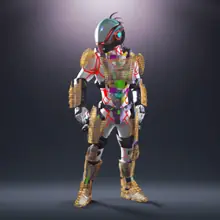 Cynova Legacy #1750 | Rare · 91st | 9 Jun 22 | 0.80 | 11 Jun 22 | 1.08 | 1.8d | +0.28 | +$5 | +35% |
 Baby Ape Tiger Club #678 | Common · 7th | 7 Jun 22 | 0.50 | 10 Jun 22 | 0.56 | 3.3d | +0.06 | +$1 | +12% |
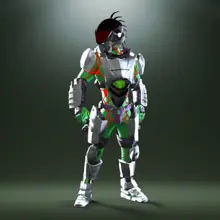 Cynova Legacy #3505 | Uncommon · 89th | 9 Jun 22 | 0.84 | 10 Jun 22 | 0.98 | 0.9d | +0.14 | +$3 | +17% |
 Neopet #4193 | Common · 37th | 4 Jun 22 | 1.00 | 9 Jun 22 | 1.11 | 4.6d | +0.11 | +$5 | +11% |
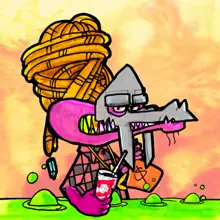 Ganja Gators #4743 | Uncommon · 81st | 7 Jun 22 | 1.50 | 9 Jun 22 | 2.68 | 1.9d | +1.18 | +$48 | +79% |
 Ganja Gators #3796 | Uncommon · 87th | 8 Jun 22 | 2.78 | 9 Jun 22 | 3.53 | 1.3d | +0.75 | +$33 | +27% |
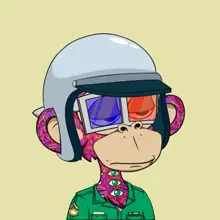 Baby Ape Social Club #4197 | Common · 61st | 9 Jun 22 | 3.69 | 9 Jun 22 | 4.56 | 0.2d | +0.87 | +$35 | +24% |
 Meerkat #1708 | Common · 22nd | 9 Jun 22 | 1.50 | 9 Jun 22 | 1.66 | 0.0d | +0.16 | +$6 | +11% |
 Bunnies N Homies #2360 | Grail · 100th | 5 Jun 22 | 6.00 | 8 Jun 22 | 7.55 | 3.0d | +1.55 | +$62 | +26% |
 Cynova Legacy #1840 | Uncommon · 75th | 7 Jun 22 | 0.55 | 8 Jun 22 | 0.63 | 0.0d | +0.08 | +$3 | +14% |
 LabMonke #4220 | Rare · 93rd | 8 Jun 22 | 0.21 | 8 Jun 22 | 0.27 | 0.0d | +0.06 | +$2 | +26% |
 LabMonke #206 | Common · 69th | 8 Jun 22 | 0.15 | 8 Jun 22 | 0.18 | 0.1d | +0.03 | +$1 | +17% |
 Capsule X #1713 | Uncommon · 84th | 1 Jun 22 | 2.46 | 7 Jun 22 | 4.05 | 5.9d | +1.58 | +$60 | +64% |
 Bunnies N Homies #3109 | Grail · 100th | 3 Jun 22 | 6.00 | 7 Jun 22 | 8.17 | 3.2d | +2.17 | +$91 | +36% |
 Ganja Gators #2616 | Uncommon · 74th | 7 Jun 22 | 1.00 | 7 Jun 22 | 1.13 | 0.5d | +0.12 | +$5 | +12% |
 Cardboard Citizens #651 | Rare · 94th | 7 Jun 22 | 4.00 | 7 Jun 22 | 4.92 | 0.0d | +0.92 | +$36 | +23% |
 Magnum #1999 | Uncommon · 73rd | 4 Jun 22 | 1.60 | 6 Jun 22 | 1.80 | 2.3d | +0.20 | +$14 | +12% |
 Cynova Legacy #3076 | Uncommon · 77th | 6 Jun 22 | 0.70 | 6 Jun 22 | 0.79 | 0.3d | +0.09 | +$4 | +13% |
GG Ganja Gators #217 | Uncommon · 90th | 5 Jun 22 | 2.20 | 5 Jun 22 | 3.08 | 0.6d | +0.88 | +$34 | +40% |
 Moshiheads #2937 | Common · 29th | 5 Jun 22 | 0.65 | 5 Jun 22 | 0.72 | 0.0d | +0.07 | +$3 | +11% |
 TENJIN #1491 | Uncommon · 84th | 4 Jun 22 | 1.16 | 4 Jun 22 | 1.42 | 0.1d | +0.26 | +$10 | +23% |
 Bunnies N Homies #4583 | Uncommon · 78th | 4 Jun 22 | 2.55 | 4 Jun 22 | 2.91 | 0.0d | +0.36 | +$14 | +14% |
 Bunnies N Homies #1414 | Uncommon · 83rd | 4 Jun 22 | 2.15 | 4 Jun 22 | 2.41 | 0.1d | +0.26 | +$10 | +12% |
MO Moshiheads #2504 | Uncommon · 89th | 4 Jun 22 | 0.90 | 4 Jun 22 | 1.03 | 0.0d | +0.13 | +$5 | +15% |
 Slot Zombie #1332 | Common · 15th | 17 May 22 | 0.06 | 3 Jun 22 | 0.09 | 17.1d | +0.03 | +$0 | +50% |
 Capsule X #317 | Common · 0th | 29 May 22 | 15.00 | 2 Jun 22 | 16.25 | 4.0d | +1.24 | −$11 | +8% |
06 — Conclusion
What Survived the JPEGs
BAYC prints another all-time high, floor past 100 ETH.
Sotheby's holds a night sale for NFTs; an Alien CryptoPunk goes for $11.8M.
Gas on a single Otherside mint runs over $1000, more than $170M burned in fees.
We were trading through the top, though you never know that while it's happening. It didn't last long, and not much after was kind to crypto. Terra collapsed in May 2022 and erased tens of billions in a week. FTX collapsed that November, trapping billions more. NFT volume drifted down fast, and the market slid into a different era: marketplaces fighting each other just to survive the bear. I moved on to other opportunities not long after.
Most of the NFTs didn't survive. Many of the collections we traded now change hands near zero, and even OpenSea, once effectively a monopoly, is fighting to stay relevant. Still, it was a genuinely interesting run, we built one of the more unusual strategies around at the time. The ideas and the lessons have survived, and they made me a better trader. Everything I've traded since has been a version of the same problem:
- The worse a market is at pricing itself, the more it pays someone who can.
- Reason from first principles when pricing something unknown: find the fundamentals everyone agrees on.
- 80% of success is showing up: roughly right and early beats precisely right and late.
Notes
Notes & Disclosures
- The pricing figures are illustrative. The BAYC collection in the pricing figures is procedurally generated for this article; its sales and listings are referenced to real trading data, and are scored, bucketed and priced by the same formulas the production system used.
- The trades are real, and on-chain-verified. The Results figures are reconstructed directly from Solana and Ethereum, across the desk's wallets, pulled and matched from the chain.
- Rarity and images come from the chain. Rarity ranks are computed from each collection's full on-chain trait table. The NFT images shown are the public on-chain artwork; some may no longer load, their links broken by burned tokens or dead marketplaces.
- Nothing here is investment advice, least of all about JPEGs.